|
|
|
The HDF-EOS to GeoTIFF Conversion Tool (HEG) converts
HDF-EOS2 objects into a
GeoTIFF
file.
This tool supports subsetting, stitching, reprojecting, and resampling.
Therefore, unlike what the name of the tool implies,
the output of the converted file is not limited to the GeoTIFF format;
it can produce HDF-EOS2 or binary format as well.
It does not support
HDF-EOS5
file.
objects into a
GeoTIFF
file.
This tool supports subsetting, stitching, reprojecting, and resampling.
Therefore, unlike what the name of the tool implies,
the output of the converted file is not limited to the GeoTIFF format;
it can produce HDF-EOS2 or binary format as well.
It does not support
HDF-EOS5
file.
This tool has a dedicated
website
that provides binaries, documents, supported products, news, etc.
We provide some practical examples here to complement the dedicated website.
From the HEG website, you can
download
the precompiled binaries for Windows, Mac, Linux, and Solaris.
You can find a detailed explanation for installing and using HEG from the
HEG Stand-alone User's Guide.
Although the
HEG Windows installation guide
doesn't mention it, HEG can run on Windows 8.
HEG provides both graphic user interface (GUI) and command line interface (CLI). The HEG GUI is an essentially parameter editor for CLI tools. It allows you to open and display the contents of an HDF-EOS file in a readable format so you can pick the desired parameters with HEG GUI. Then, the HEG GUI performs the conversion by running the HEG CLI tools using the parameters that you selected.
The HEG CLI tools include hegtool, resample, gdtif, swtif, and subsample_grid. We will show the CLI examples after the GUI examples because we will reuse the parameter files that the HEG GUI created.
When you open an HDF-EOS2 file with File > Open > Hdf-Eos,
HEG shows a list of grids or swaths under Objects and
data fields within a grid or a swath under Fields.
HEG also retrieves metadata information about the grid or the swath
and shows it under the Object Info section. This information includes the projection information
and coordinates of four corners of the region of the selected grid.
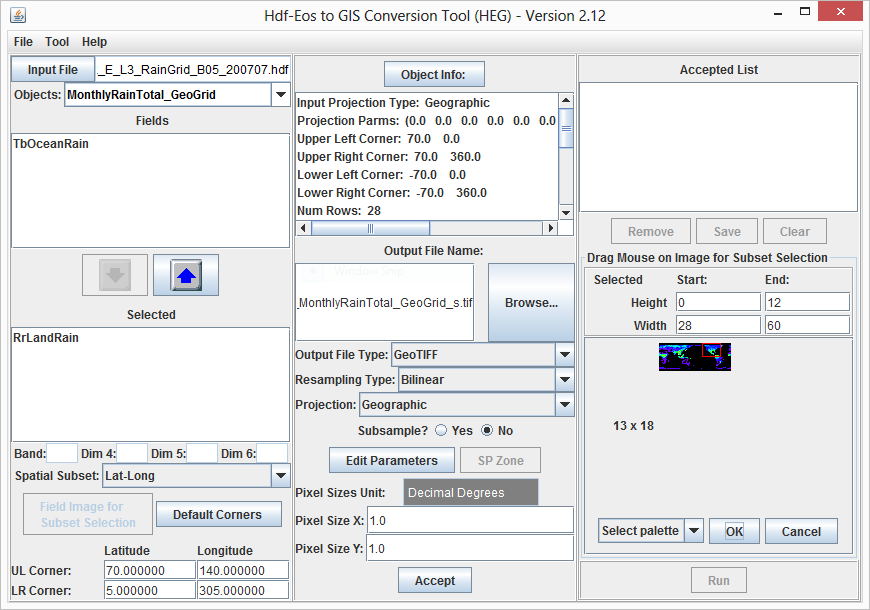
The Figure 1 shows an example that converts a data field from an HDF-EOS2 Grid file
in geographic projection.
Specifically, we use one
AMSR-E rain grid
file from NSIDC and you can download the file
here.
You can select one or more data fields from the list in the Fields by pressing the blue down-arrow button. If multiple data fields are selected, the generated GeoTIFF file will have multiple bands.
You can also edit choose Output File Type, Resampling Type, and Projection. As mentioned earlier, this tool can be used to generate not only GeoTIFF files but also HDF-EOS2 files or binary files. Several projection methods, such as the geographic projection and the polar stereographic projection, can be chosen for the generated files. Then, you can accept the conversion parameters by pressing the Accept button.
Then, the Accepted List area will show a string that is a concatenation of an object name, "->", and a dataset name. Also, the Run button will be activated. Simply press the Run button to start the conversion process. A new Status window will pop up, and it will show the progress of the conversion. If there is an error, the error message will appear on the Status window.
The following Figure 1a demonstrates that you can visualize the converted GeoTIFF file with a GeoTIFF tool like ArcGIS Desktop.
The following subsections briefly demonstrate 5 more use cases of HEG GUI.
You can always refer to
HEG Stand-alone User's Guide
for other usages and details.
From the above example shown in Figure 1a, you may want to subset a region of your interest (e.g., North America) and convert it only that region to GeoTIFF. The HEG GUI provides a convenient way of subsetting a region with a few mouse clicks and convert it to GeoTIFF.
After opening an HDF-EOS2 file, please click the Field Image for Subset Selection button at the left bottom corner in the HEG GUI. Then, an image will appear at the right bottom area of the window above the Run button as shown in the Figure 1-1 below. You can compare the screenshot with the Figure 1. By default, the image will appear as grey scale. You can make it colorful by selecting a different palette using the Select palette drop down list. In Figure 1-1, we use Rainbow palette.
Once the image appears, you can use mouse to select the region of your interest. Click anywhere on the image and hold the mouse button while moving the mouse. You'll see a red box appear for your selection area. If the red box matches your region of interest, press OK. You will notice that the main HEG GUI window automatically updates the values in the UL Corner: and LR Corner at the left bottom corner of the window based on your selection.
Finally, press Accept and then Run button. The following Figure 1-1a demonstrates that you can visualize the subsetted GeoTIFF file with a GeoTIFF tool like ArcGIS Desktop.
Since HEG can perform resampling,
the projection method of the resulting GeoTIFF file can be
different from the original projection method of the given HDF-EOS2 file.
For example, one can choose the geographic projection for the GeoTIFF file
even though the source grid uses the North-polar stereographic projection like
the
AMSR-E Sea Ice
product from NSIDC. You can download the sample file
here.
One can also choose resampling method among three options as the following
Figure 2 shows.
The following Figure 2a demonstrates that you can visualize the converted GeoTIFF file with a GeoTIFF tool like ArcGIS Desktop.

Even for swath data fields, you can choose various projection methods to generate GeoTIFF files. Since HEG can generate HDF-EOS2 files as well as GeoTIFF files, HEG can be used to convert a swath data field into a grid data field.
One limitation is that you can choose only one resampling method, Nearest Neighbor, as you can see from the following Figure 3. In this example, we used an MODIS/Aqua Land Surface Temperature and Emissivity 5-Minute L2 Swath 1km (short name:MYD11_L2). You can download the sample file here.
The following Figure 3a demonstrates that you can visualize the converted GeoTIFF file with a GeoTIFF tool like ArcGIS Desktop.
To stitch multiple HDF-EOS files into a single GeoTIFF file, you need to select Tool > Stitch/Subset menu as shown in Figure 4.
Then, you can open one file at a time using File > Open > Hdf-Eos menu. In this example, we'll use the following two MOD09A1 products.
The file you opened first will appear at the top and the file you opened last will appear at the bottom under Input Files: list box. The Figure 5 shows that we opened the MOD09A1.A2013241.h09v06.005.2013252122246.hdf file first. By default, HEG GUI will use use the first file name in the list for output GeoTIFF file name. HEG will also use the first file name in the list if you select Yes for Save Stitched File? option. For example, the output GeoTIFF file name for sur_refl_b01 data field in our example will be MOD09A1.A2013241.h09v06.005.2013252122246_MOD_Grid_500m_Surface_Reflectance.tif and stitched HDF-EOS2 file name will be MOD09A1.A2013241.h09v06.005.2013252122246_MOD_Grid_500m_Surface_Reflectance_stitched_.hdf.
The following Figure 5a demonstrates that you can visualize the converted GeoTIFF file with a GeoTIFF tool like ArcGIS Desktop.
MISR HDF-EOS2 products use Space Oblique Mercator (SOM) projection. Thus, MISR datasets have an extra dimension called SOM block. HEG GUI allows you to select a set of blocks and merge them into a single Grid. This section will explain how to combine some consecutive blocks of data into one.
If you download a sample MISR file and open it with the HEG GUI, you'll see a list of available objects next to Objects: as shown in Figure 6.
Select the BlueBand and press the blue down arrow button. Then, you'll see a new question dialog box pops up as shown in Figure 7.
Click Yes and you will see a new window as shown in Figure 8. We click the Yes because HEG tool doesn't work on blocks that have 0 in Quality Flag, which you can find in the second column of the table in Figure 8. Our example has 0 for Quality Flag from block #1 to #34. In this example, we select 35 to 40 by entering the numbers in the Begin Block: and End Block: text box. Then, press OK button.
When the subsetting chooser disappears, you will notice that the main HEG GUI window automatically updates the values in the UL Corner: and LR Corner at the left bottom corner of the window based on your selection of MISR SOM blocks. The following Figure 9 shows the updated HEG GUI and you can compare it with the Figure 6.
You are now ready to convert the selected blocks of MISR data into a single GeoTIFF by pressing Accept button and then Run. The following Figure 9a demonstrates that you can visualize the converted GeoTIFF file with a GeoTIFF tool like ArcGIS Desktop.
The HEG GUI described above relies on the HEG CLI tools for processing user input parameters. Thus, you can execute HEG CLI tools without GUI by creating user input parameter files in ASCII and supplying them to CLI tools. This section will explain how to use HEG CLI to subset, reproject, resample, and stitch by providing the sample parameter files required by the commands.
The following examples assume that you installed HEG on a Windows machine and we will use Windows style command prompt and argument in the figures.
To run any HEG CLI tool except hegtool, you need to set up the following environment variables first.
HEGTool.bat.
Although this is not a converter, it reads the metadata information from an HDF-EOS file and returns an ASCII file so that you can examine the contents of the HDF-EOS file easily with any text editor. To run it, issue a command like Figure 10.
hegtool
The above command will create a default header file called
HegHdr.hdr
under c:\HEG\HEG_Win\bin (not C:\TMP).
You can open the header file with any text editor.
The file contains number of objects, names of objects, projection parameters,
and other parameters as shown in Figure 11.
hegtool
The resample converter tool performs conversions on HDF-EOS Grid objects for non-MISR data. You can also subset Grid with this tool.
The sample input parameter file is available here. This file is obtained by running the HEG GUI as shown in Figure 1. You can edit the input parameter file with any text editor. Try to modify the following line by changing the value from 18000.0 to 3600.0 and run the above command in Figure 12 again.
If you open the converted GeoTIFF file created by the resample CLI tool,
you will get an image with much smaller (i.e., 1/5) pixel size as shown in Figure 12b
(cf. Figure 1a).
The swtif converter tool is used to read a Swath object from an HDF-EOS file and convert it to a grid with all supported projections. You can also subset Swath with this tool.
swtif
The sample input parameter file is available here. This file is obtained by running the HEG GUI as shown in Figure 3.
The subset_stitch_grid (or subset_stitch_swath) converter tool is used to read 1 or more similar grids (or swaths) from HDF files, convert them to grids with one of supported projection and stitch them together. During the conversion the tool also performs subsetting using the user provided subset upper left and lower right corner points (lat/lon) for the subset box.
subset_stitch_grid
The sample input parameter file is available here. This file is obtained by running the HEG GUI as shown in Figure 5.
This is similar to resample but it is for MISR data.
gdtif
The sample input parameter file is available here. This file is obtained by running the HEG GUI as shown in Figure 9.
As you've seen from the above examples,
the CLI tools except hegtool require an input parameter file.
If you've run the HEG GUI tool and created a GeoTIFF file,
you'll find a parameter file called HegXXXXX.prm_username
under install_prefix/bin directory
like C:/HEG/HEG_Win/bin/.
The XXXXX is one of Prm (resample), Swath (stif),
GridStitch (subset_stitch_grid), and Misr (gdtif).
The username is one that you entered during the HEG tool installation.
The default input parameter file is overwritten every time you run the HEG GUI,
so it is necessary to save them as different file names
if you plan to reuse them with CLI tools later.
After HEG generates GeoTIFF files, you may want to verify the result using visualization tools. Many GeoTIFF visualization tools are available such as Google Earth Pro, ArcGIS, and Global Mapper.