|
This page explains how to use HDF-EOS2 C APIs to retrieve longitude and latitude values that define the location of a data field of which values are stored in an HDF-EOS2 grid file. The example provided in this page is general in the sense that it can be used for any projection provided by the HDF-EOS2 library.
Those who are not familiar with HDF-EOS2 C APIs need to read How to Read HDF-EOS2 Grid Data in C, which explains the basic knowledge of using HDF-EOS2 C APIs to access the grid data.
Longitude and latitude values are determined per grid object. In other words, one file
can have multiple longitude and latitude values if there are multiple grid objects. This also
implies that all data fields in one grid object share the same longitude and latitude values.
In this page, we will assume that one grid object is already attached by calling
GDattach, and its identifier is grid1.
An HDF-EOS2 grid object contains not only data fields but also several attributes. These attributes include several parameters such as the size of the grid, the projection method and the projection-related parameters that are necessary to retrieve all longitude and latitude values from the HDF-EOS2 library. The HDF-EOS2 library provides APIs to retrieve these parameters. The following is a list of APIs and information retrieved from them:
GDgridinfo: grid size, corner locations
GDprojinfo: projection information
GDpixreginfo: pixel registration information
GDorigininfo: pixel origin information
 .
.
The HDF-EOS2 library provides an API GDij2ll that allows users to get
longitude and latitude values.
Figure 1 shows how to use GDij2ll to retrieve longitude and latitude.
Error-handling code is removed to make the code easy to follow.
GDij2ll, two parameters, lon and lat, are used as outputs that
store latitude and longitude values.
Other parameters are inputs to GDij2ll. Most inputs are directly retrieved from
GDgridinfo, GDprojinfo, GDpixreginfo and GDorigininfo. However,
two inputs, row and col, require some background knowledge.
We will explain why row and col are needed when calling GDij2ll with an example.
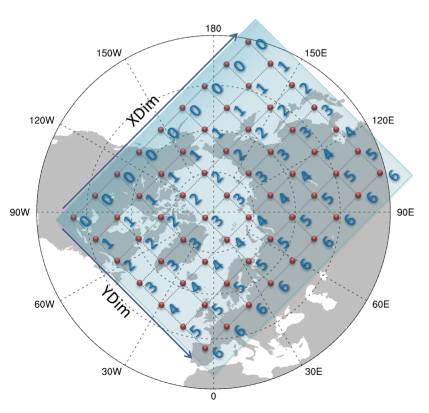
Figure 2 shows a grid using the North Polar Stereographic projection.
If an HDF-EOS2 Grid file does not have the dimension names exactly same as the standard dimension names for longitude and latitude (i.e., XDim and YDim), neither the HDF-EOS2 library (GDij2ll) nor the HDF-EOS2 dumper tool can dump the correct value for the latitude and longitude.
The HDF-EOS2 library uses a horizontal Cartesian coordinate system to represent the index of each data point. A horizontal Cartesian coordinate system needs to define an origin and two orthogonal axes. Figure 2 illustrates a horizontal Cartesian coordinate system that the HDF-EOS2 library uses. In this example, XDim represents one axis and YDim represents another axis. The maximum index number along the XDim axis is 9 and the maximum index number along the YDim axis is 7. The origin (0,0) of the coordinate system is the intersection of XDim and YDim.
The GDgridinfo will retrieve the grid size and the latitude and longitude values of
the upper-left and the lower-right corners of a grid. The physical location of the upper-left is always
treated as the origin of the horizontal Cartesian coordinate system. The location of any data point can
then be represented unambiguously with the Cartesian coordinate such as (1,5), (0,4).
Intuitively the position of the location can be represented as "row" and "column".
The origin point is row 0 and column 0. The number of "row" is 0 for a location where the value of the second component of the coordinate
is 0. Accordingly, the number of "row" will increase as the value of the second component of the coordinate location increases.
Similarly, the number of "column" is 0 for a location where the value of the first component of the coordinate is 0.
So position (1,5) is at "column" 1 and "row" 5.
GDij2ll needs the application to provide values of "column" and "row" to retrieve values of latitude and longitude.
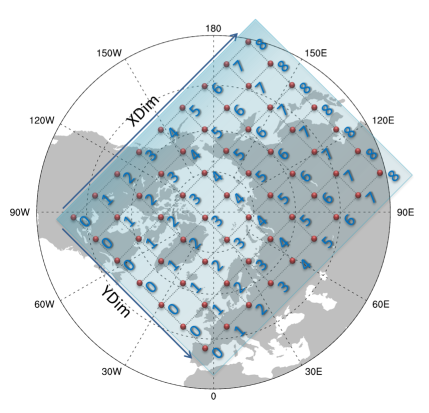
Figure 3 demonstrates the "row" number and the "column" number for each location shown in Figure 2.


Assuming the row-major order, one can use the following code to assign values for row and col.
One way is to use two loops as Figure 4 shows.
After providing row and col arrays and other parameters to GDij2ll,
longitude and latitude values will be calculated and stored at two variables
lon and lat, respectively. Figure 5 shows
the contents of lon and lat after calling GDij2ll. For our purposes here,
we use approximate numbers in several locations.
Now that we have all longitude and latitude values, we can relate a data element to the location where this element was measured. Figure 6 shows a loop that dumps elements of a data field with locations and meaningful messages.
tbocean[YDim][XDim] in C. YDim is called the first dimension.
XDim is called the second dimension.
If YDim is the first dimension, row and col should be assigned
differently. To the best of our knowledge, HDF-EOS2 does not provide any API
to detect which dimension is the first. One possible way is to traverse data fields in the grid object and see
which dimension comes first. Since XDim and YDim are special dimensions defined by
HDF-EOS, checking their names is sufficient. One can also use HDF View to check the order of dimensions.
Check Retrieve Dimension Names and Sizes using HDFView .
One may notice that it is not necessary to retrieve XDim times YDim longitude and latitude values for some projections. Figure 7 shows one case.
In Figure 7, the geographic projection is used. The feature of this projection is that the same latitude value is shared for those locations on the same row and the same longitude is shared for those locations on the same column. This means we only need to use an array with 14 elements to describe longitude values and an array with 8 elements to describe latitude values. The Cartesian product of the 14 longitude values and the 8 latitude values gives the exact coordinates of 112 locations where data elements were measured. One can cleverly passrow and col to GDij2ll so that this function fills only
necessary longitude and latitude values. Alternatively, one can first pass comprehensive row and col
to GDij2ll, and then drop unnecessary longitude and latitude values if repeated values are detected.
To get the complete source code that reads one AMSR-E
AE_RnGd grid object, see
here.
You can download the file used in this code
here.