|
This example provides how to use Microsoft Excel 3D Maps with NASA HDF-EOS data products. 3D Maps is available in Excel 2016 for Windows. Unfortunately, Mac version doesn't have 3D Maps yet.
Excel cannot import HDF-EOS data directly. Thus, you need to generate ASCII values or create CSV file that can Excel read. Or, you need to import data through ODBC or Excel add-in.
There are serveral ways to generate text (ASCII) data for copy & paste or CSV files from HDF-EOS. In this example, we'll focus on OPeNDAP and provide links for other methods.
If NASA data center provides OPeNDAP service (e.g., Hyrax or THREDDS), OPeNDAP is probably the easiest way to get the (subsetted) data in ASCII for copy & paste with mouse and/or to create CSV file that Excel can import.
For example, if you visit here for OCO-2 L2 Swath data, you can see HTML-based form that allows you to select dataset.
Please select the following variables using the check boxes next to each variable in the form. You need to scroll down the web page to find these variables.
_RetrievalGeometry_retrieval_latitude_RetrievalGeometry_retrieval_longitude_RetrievalResults_xco2 . A sample programmatic access of OPeNDAP server and creation of CSV file using Python is available here
 .
.
There are other ways to generate text/csv data. Please click the link to find how.
This method works only for HDF5 data product. Thus, it is necessary to convert HDF4 into HDF5 if your NASA data product is in HDF4. Please click the link to find learn how to import data directly.
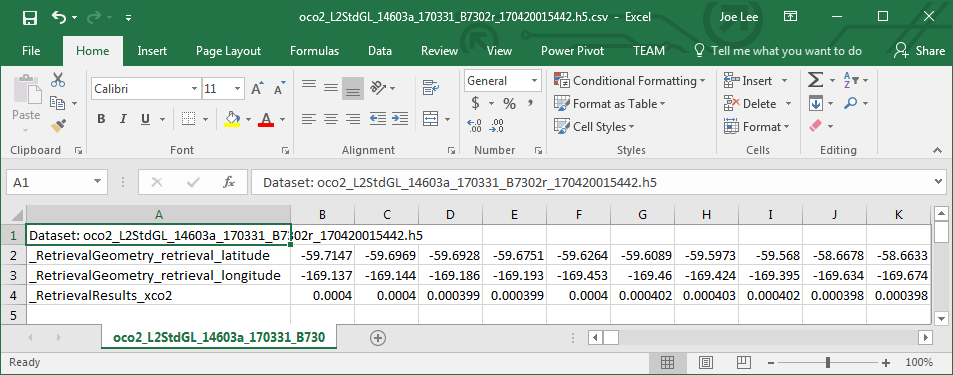
Open the CSV file that is generated and saved from OPeNDAP response (Figure 1).
 Figure 1. Opening CSV file with Excel
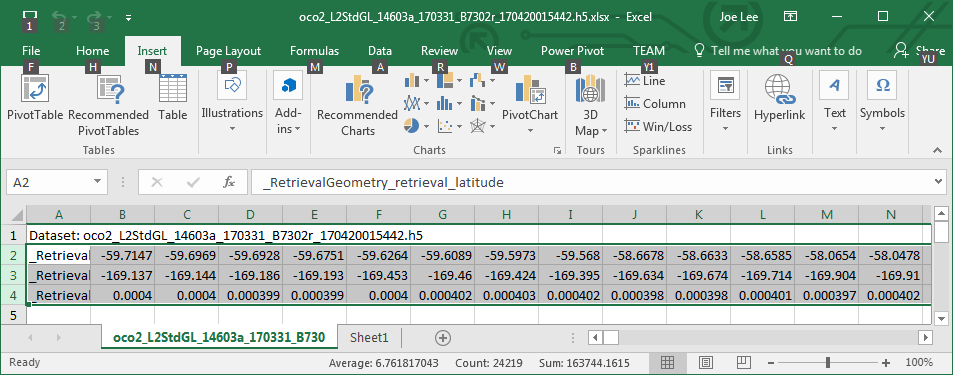
It is necessary to save as Excel file. Then, select 3 rows of data excluding the first row (Figure 2).
 Figure 2. Saving CSV file as Excel and selecting data rows
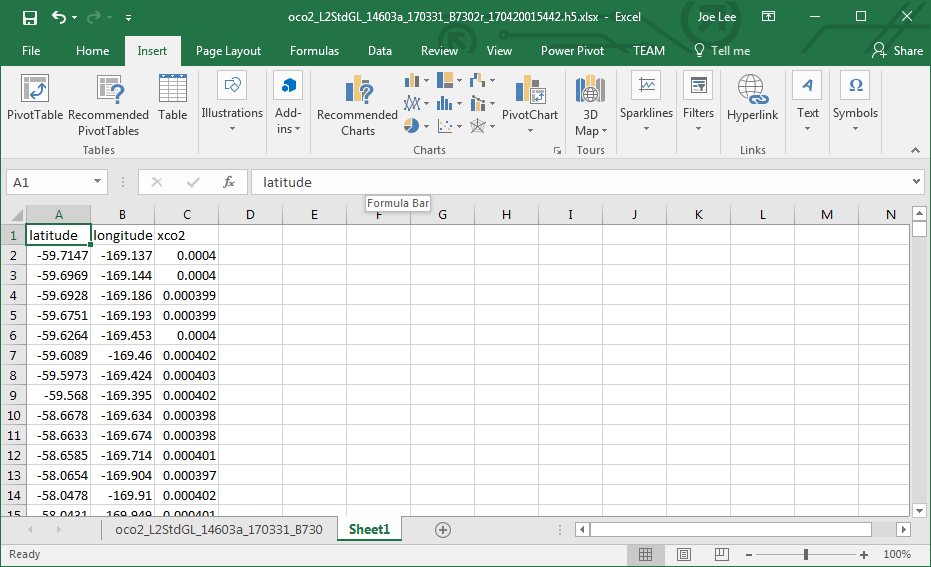
Re-format data in column-oriented manner to visualize data with 3D Maps properly. Open a new sheet, copy 3 rows of lat/lon/xco2, and paste transpose. Rename column names to latitude, longitude, and xco2.
 Figure 3. Transposing data and renaming columns
Select Insert > 3D Map >
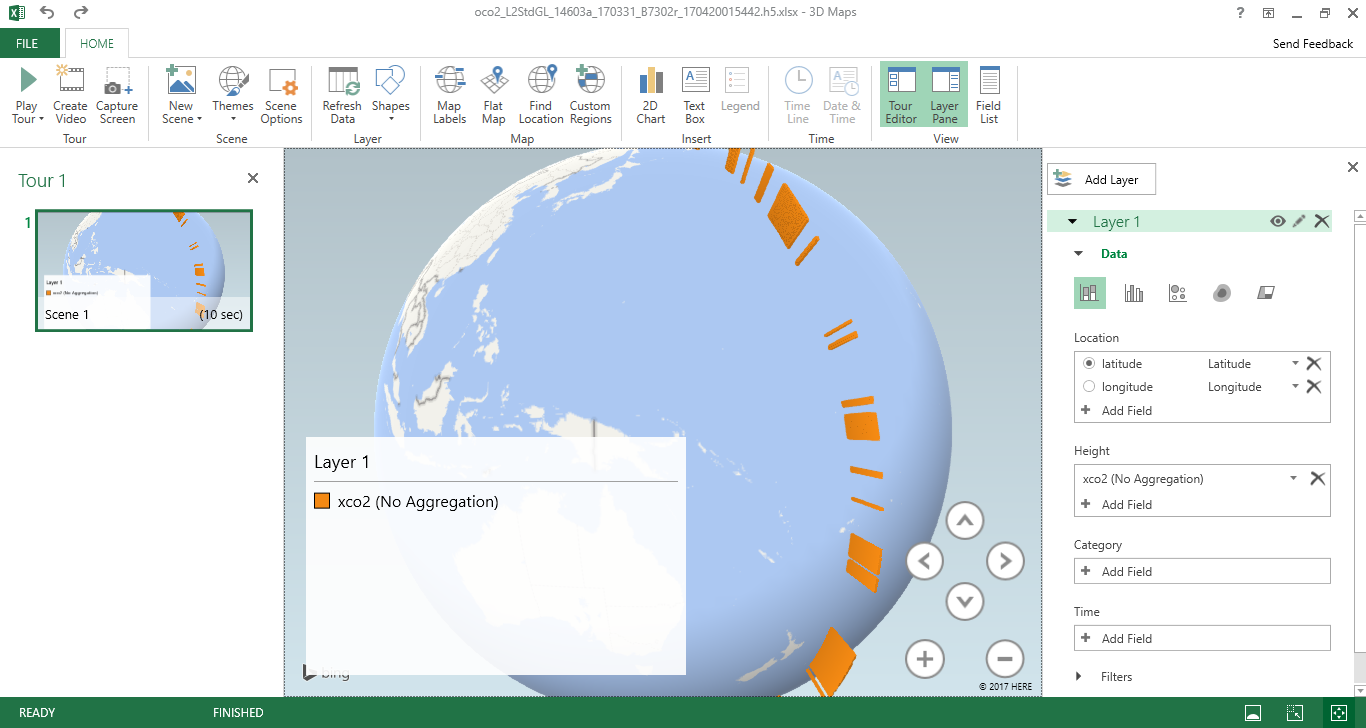
Finally, set xco2 column value as height to visualize the data in 3D (Figure 5).
 Figure 5. Selecting xco2 variable as height
Please note that Excel has 1,048,576 rows by 16,384 columns limit.