Contents
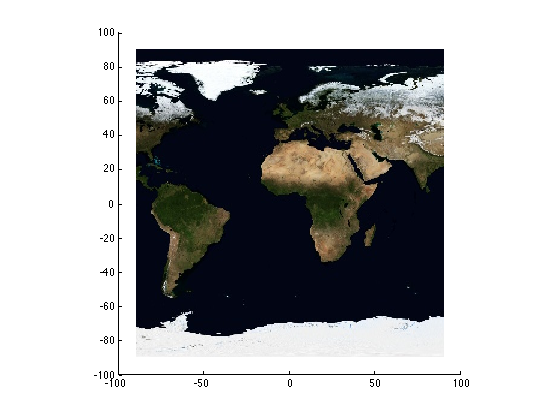
Get Blue Marble map of the earth
nasa = wmsfind('nasa', 'SearchField', 'serverurl');

layer = nasa.refine('bluemarbleng', ...
'SearchField', 'layername', 'MatchType', 'exact');

layer = wmsupdate(layer);
Set the latitude and longitude limits of our map
latlim = [-90 90];
lonlim = [-90 90];
[blueMarble, Rmarble] = wmsread(layer,'Latlim',latlim,'Lonlim',lonlim);
geoshow(blueMarble,Rmarble)
Let's look at the NOAA Central Pacific OpenWatch Thredds server
baseurl = 'http://oceanwatch.pifsc.noaa.gov/thredds';
web(baseurl,'-browser');
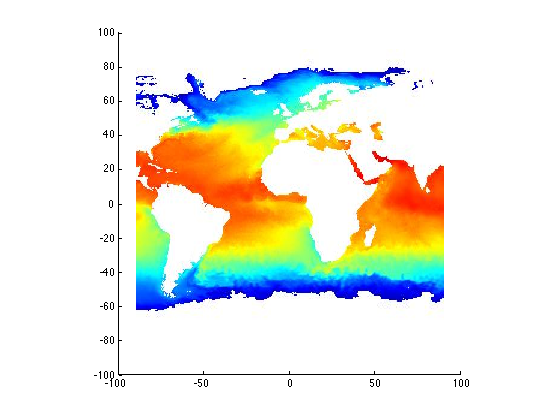
Get Sea Surface Temperature (2-day) from OceanWatch
wmsurl = 'http://oceanwatch.pifsc.noaa.gov/thredds/wms/goes-poes/2day?service=WMS&version=1.3.0&request=GetCapabilities';
info = wmsinfo(wmsurl);
[goes,Rgoes] = wmsread(info.Layer,...
    'ImageHeight',size(blueMarble,1),...
    'ImageWidth',size(blueMarble,2),...
    'Latlim',latlim,'Lonlim',lonlim);
geoshow(goes,Rgoes);
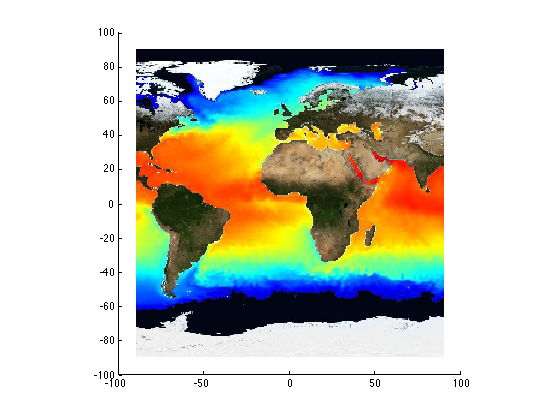
Composite the GOES sea surface temperature on top of the map
threshold = 180;
index = any(goes < threshold, 3);
index = cat(3, index, index, index);

combined = blueMarble;
combined(index) = goes(index);
Show the compositied image
geoshow(combined,Rmarble);
Use the NetCDF to get detailed info about the surface temperature
ncurl = 'http://oceanwatch.pifsc.noaa.gov/thredds/dodsC/goes-poes/2day';
ncdisp(ncurl);
Source:
           http://oceanwatch.pifsc.noaa.gov/thredds/dodsC/goes-poes/2day
Format:
           64bit
Global Attributes:
           title                     = 'GOES-POES SST - 2Day'
           summary                   = 'Sea-Surface Temperature'
           keywords                  = 'EARTH SCIENCE > Oceans > Ocean Temperature > Sea Surface Temperature'
           keywords_vocabulary       = 'GCMD Science Keywords'
           id                        = 'GP2013186_2013187_sst'
           grid_type                 = 'REGULAR'
           naming_authority          = 'gov.noaa.pifsc.oceanwatch'
           cdm_data_type             = 'Grid'
           date_created              = '2013-07-07'
           date_issued               = '2013-07-07'
           project                   = 'NOAA CoastWatch/OceanWatch - Central Pacific'
           processing_level          = '3'
           acknowledgements          = 'NOAA National Environmental Satellite, Data and Information Service'
           geospatial_lat_min        = -90
           geospatial_lat_max        = 89.9
           geospatial_lat_resolution = 0.05
           geospatial_lat_units      = 'degrees_north'
           geospatial_lon_min        = 0
           geospatial_lon_max        = 360
           geospatial_lon_resolution = 0.05
           geospatial_lon_units      = 'degrees_east'
           time_coverage_start       = '2013-07-05T00:00:00Z'
           time_coverage_end         = '2013-07-06T23:59:59Z'
           contributor_name          = 'NOAA OceanWatch - Central Pacific'
           contributor_url           = 'http://oceanwatch.pifsc.noaa.gov'
           product                   = 'Sea-Surface Temperature'
           westernmost_longitude     = 360
           easternmost_longitude     = 0
           southernmost_latitude     = -90
           northernmost_latitude     = 89.9
           satellite                 = 'NOAA GOES-E/W, NOAA-19, METOP-A, MSG, MTSAT'
           sensor                    = 'NOAA GOES-E/W, NOAA-19, METOP-A, MSG, MTSAT'
           origin                    = 'NOAA OceanWatch - Central Pacific'
           cwhdf_version             = '3.4'
           composite                 = 'true'
           projection_type           = 'mapped'
           projection                = 'Geographic'
           gctp_sys                  = 0
           gctp_zone                 = 0
           gctp_parm                 = [0.00e+00 0.00e+00 0.00e+00 0.00e+00 0.00e+00 0.00e+00 0.00e+00 0.00e+00 0.00e+00 0.00e+00 0.00e+00 0.00e+00 0.00e+00 0.00e+00 0.00e+00]
           gctp_datum                = 12
           et_affine                 = [0.00e+00 -5.00e-02  5.00e-02  0.00e+00  2.50e-02  9.00e+01]
           rows                      = 3.6e+03
           cols                      = 7.2e+03
           history                   = 'File generated at NOAA OceanWatch - Central Pacific'
           Conventions               = 'CF-1.0, CW HDF, COARDS'
           references                = 'Refer to NOAA NESDIS http://www.nesdis.noaa.gov/'
           institution               = 'NOAA/NESDIS/OceanWatch - Central Pacific'
           source_data               = 'NOAA National Environmental Satellite, Data and Information Service'
           comment                   = 'GOES SST data product'
           pass_date                 = [1.59e+04 1.59e+04]
           start_time                = [1.00e+00 1.00e+00]
           temporal_extent           = [8.64e+04 8.64e+04]
           license                   = 'The data may be used and redistributed for free but is not intended for legal use, since it may contain inaccuracies. Neither OceanWatch, NOAA, nor the US Government, nor any of their employees or contractors, make any warranty, express or implied, including warranties of merchantability and fitness for a particular purpose, or assumes any legal liability for the accuracy, completeness, or usefulness, of this information.'
Dimensions:
           lat   = 3600
           lon   = 7200
           nbnds = 2
           time  = 320
Variables:
    lat
           Size:       3600x1
           Dimensions: lat
           Datatype:   double
           Attributes:
                       _CoordinateAxisType = 'Lat'
                       actual_range        = [-9.00e+01  8.99e+01]
                       coordsys            = 'geographic'
                       long_name           = 'Latitude'
                       point_spacing       = 'even'
                       standard_name       = 'latitude'
                       units               = 'degrees_north'
                       axis                = 'Y'
    lon
           Size:       7200x1
           Dimensions: lon
           Datatype:   double
           Attributes:
                       _CoordinateAxisType = 'Lon'
                       actual_range        = [0.00e+00 3.60e+02]
                       coordsys            = 'geographic'
                       long_name           = 'Longitude'
                       point_spacing       = 'even'
                       standard_name       = 'longitude'
                       units               = 'degrees_east'
                       axis                = 'X'
    time
           Size:       320x1
           Dimensions: time
           Datatype:   double
           Attributes:
                       units        = 'days since 1800-1-1 00:00:00'
                       long_name    = 'Time'
                       actual_range = [7.80e+04 7.80e+04]
                       axis         = 'T'
                       bounds       = 'time_bnds'
    time_bnds
           Size:       2x320
           Dimensions: nbnds,time
           Datatype:   double
           Attributes:
                       long_name = 'Time Boundaries'
    sst
           Size:       7200x3600x320
           Dimensions: lon,lat,time
           Datatype:   single
           Attributes:
                       _FillValue           = -3.4e+38
                       long_name            = 'Sea-Surface Temperature'
                       missing_value        = -3.4e+38
                       numberOfObservations = 2.59e+07
                       units                = 'degrees Celsius'
                       short_units          = 'deg. C'
Read 'lat','lon', and 'time' variables from this dataset
lat = ncread(ncurl,'lat');
lon = ncread(ncurl,'lon');
time = ncread(ncurl,'time');
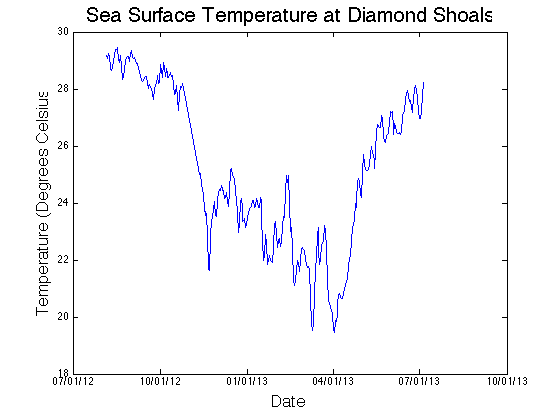
Get theSurface temperature history of a point just off the coast of NC!
diamondShoals = [35 360-75];
latInd = find(lat == diamondShoals(1));
lonInd = find(lon == diamondShoals(2));
Read the surface temperature off the coast of Cape Hatteras
surfaceTemp = ncread(ncurl, 'sst',[lonInd latInd 1],[1 1 319]);
surfaceTemp = reshape(surfaceTemp,1,size(surfaceTemp,3));
Recompute the Time relative to Jan-1-0000
timeStamps = time(1:end-1) + datenum('1800-1-1 00:00:00');
Show the 2-day average surface temperature for the past year
figure;
plot(timeStamps, surfaceTemp);
title('Sea Surface Temperature at Diamond Shoals','FontSize',20);
xlabel('Date','FontSize',16);
ylabel('Temperature (Degrees Celsius)','FontSize',16);
datetick('x','mm/dd/yy');